Monday 27 April 2015

The Third 'C' of Mega Data:Calculate

This is the third in the series of blogs about the element of the Mega Data ecosystem.

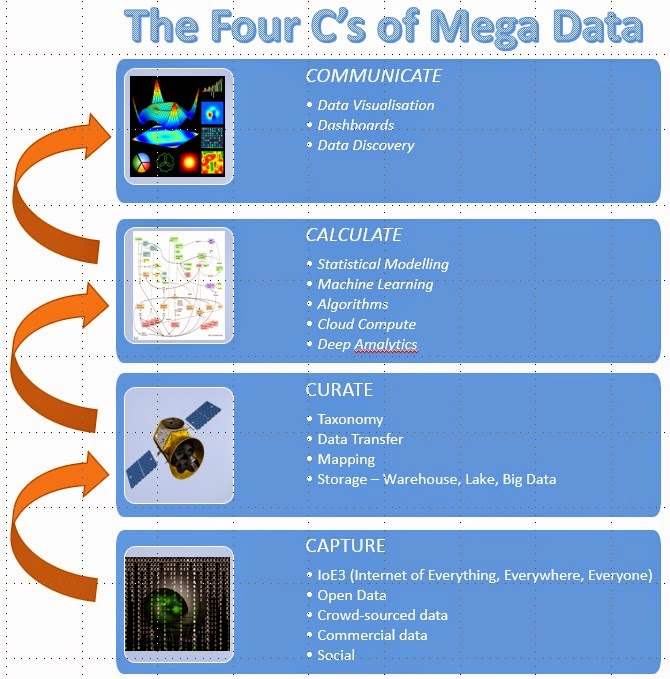
As a reminder, we started with a description of what's needed right at the beginning of the data chain in order to make the whole ecosystem viable - i.e. CAPTURE the data and have a means of addressing devices.

After capturing the data, we examined the architectures available to shift and store the captured data and how to CURATE it.

Now that we have the data, what do we do next to turn it into actionable information?  Well, we need a way of applying business rules, logic, statistics, maths "& stuff", i.e. the CALCULATE layer.

Statistical Modelling

Once the domain of products such as SAS and IBM's SPSS, this approach takes traditional statistical techniques to, among other things, determine correlation between data points and establish linkages using parameters, constants and variables to model real world events.
Very much "Predictive 1.0", these products have evolved massively from their original versions.  They now include comprehensive Predictive Analytics capabilities, extending far beyond the spreadsheet-based "what-if?" analysis.

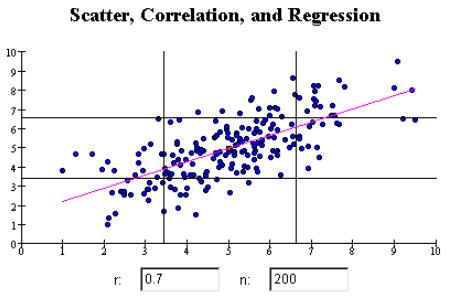
The new kid on the street is "R", an Open Source programming language which provides access to many statistical libraries.  Such is the success of this initiative that many vendors now integrate with R in order to extend their own capabilities.

Machine Learning

Whereas with Statistical Modelling, which starts with a hypothesis upon which statistics are used to verify, validate and then model the hypothesis, Machine Learning starts with the data....and it's the computer that establishes the hypothesis.  It then builds a model and then iterates, consuming additional data to validate its own models.


This is rather than Data Mining at Hyperspeed.  It allows data to be consumed, and models created, from which no prior (domain specific) knowledge is required.  A good demonstration of this can be seen on the aiseedo.com cookie monster demonstration.

Cognitive Computing

This brings together machine learning and natural language processing in order to automate the analysis of unstructured data (particularly written and spoken data).  As such, it crosses the boundaries between the computation and the analysis layers of the Mega Data stack.  Further details have been published on the Silicon Angle website.

Algorithms

Algorithms are the next step on from statistical modelling.  Statistics identify trends/correlations and probabilities.  Algorithms are used to provide recommendations and are deployed extensively in electronic trading.  This architecture of a Trading Floor from Cisco illustrates their use:


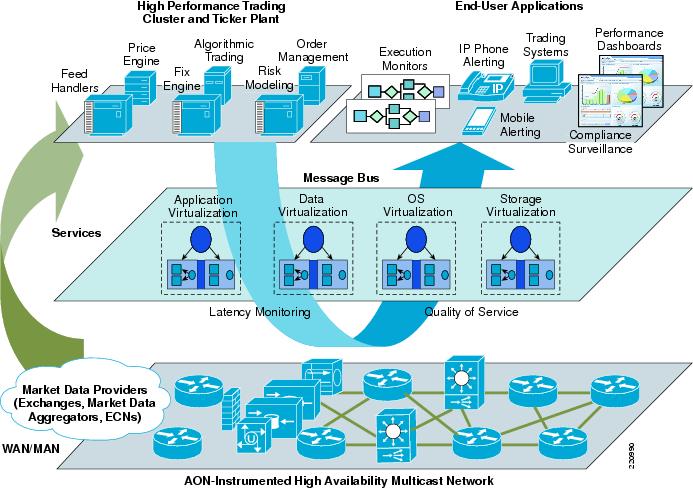
As can be seen from the above, algorithmic trading takes data from many other sources, including price and risk modelling, and is then used to deliver an automated trading platform.

Deep Analytics

Probably the best known example of this genre is IBM's Watson.  This technology was developed to find answers in unstructured data.  Its first (public) application was to participate in the US TV show Jeopardy!.


The novel feature about the TV show was that, unlike typical quiz shows where contestants are asked to answer questions, the competitors are given the answer and need to identify what the question is.  This provided an usual computing challenge against which the developers of IBM's Watson succeeded when the system competed against two of the show's previous winners and won in February 2011.

Cloud Compute

So far the other elements described in this blog are about the maths.  How you provide the compute capability is where Cloud Compute fits nicely.

If you have unlimited funding available, then a typical architecture to run your compute needs is on a supercomputer.  These are, however, incredibly expensive, and are the remit of government sponsored organisations.  The current "top of the range" supercomputer is the Chinese Defence  Tiahne-2,

With over three million CPU cores, it featured as the number 1 supercomputer in the World in November 2014.

An alternative means of harnessing power is to use Grid Computing, which links many computers together:


This brings an advantage that compute power can be added as needed.

Finally, Cloud Compute provides the most flexible means of accessing compute power as the consumer of the compute doesn't normally need to procure/provision the hardware themselves.  This means that compute is available using a per use pricing model.


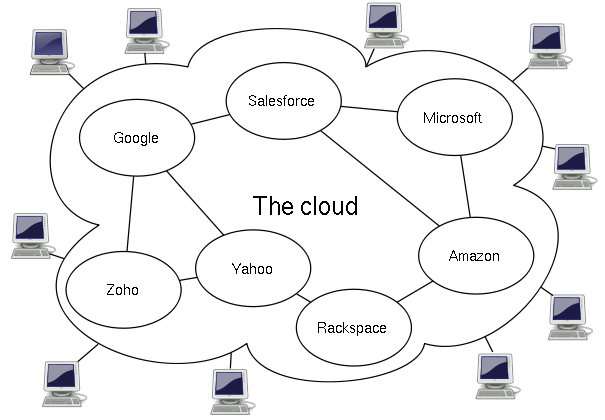
This typically provides access to extensible compute power without the upfront procurement costs and so makes it incredibly flexible and cost effective.

Hopefully this snapshot of compute architectures provides a useful starting point from which we'll examine in greater detail how such capabilities can be exploited.

A reminder finally that we have a Meetup Group which provides the opportunity to meet like minded people and to hear from others about the Mega Data Ecosystem.

Check out these additional resources:
Meetup Mashup Group
Meetup Mashup LinkedIn Group
Facebook Page
Google+ Community

Friday 17 April 2015

The Second 'C' of Mega Data: Curate

This is the next in a series of blogs discussing The Four C's of Mega Data.  The previous article, The First 'C' of Mega Data, described the sheer volume of devices, connections and data generation that is forecast over the next few years.  This time we'll look at how the data, once captured, can be curated i.e. extracted and stored in a usable form.

Firstly, it's worth explaining why use the word "Curate", as opposed to "collect", "contain" or "compile".  If we look at Wikipedia's definition of the term Digital Curation:

We can see that curate covers so much more than simply extracting and storing digital assets.  As data volumes continue to grow, we will see a transition from traditional extract and storage methods to more scalable and flexible solutions.

Traditional Data Warehouse architectures take data from source system(s) and load it into a centralised database structured optimally for reporting and analytics.  This mechanism is regularly described as Extract-Transform-Load (ETL).

Whilst there are variation on this architecture, the principle is remains that data is taken from source systems, "tranformed" (e.g. aggregated, converted, made consistent, conformed, mapped t reference data), and then loaded into a database using a denormalised format.  Whilst database purists often balk at the theoretical inefficiency of denormalising data (as it leads to significant duplication of data) it actually provides a faster means for the data to then be analysed and reported on.  The main ETL variation,touted by some vendors is Extract-Load-Transform (ELT).  In this case the data is loaded into the central repository before transformation rules are applied.

So, what will future data curation architectures look like?  This depends upon which vendor you ask!  Main contenders include terms such as Data Federation, Data Virtualisation, Schema on Readand Data Lakes.  The latter being a term that sends shivers down the spine when one wonders.....whilst you'd be willing to put your physical assets into a warehouse, would you willingly tip them into a lake?

Data Federation is nicely described by SAS with this diagram:


In comparison,  Information Management illustrates Data Virtualisation as:

So, not really much difference.  In both cases source data is segregated from the presentation layer and the source data remains in the original location, i.e. it's no longer physically copied to a single central repository.

The interesting development is with Schema on Read vs Schema on Write.  The qucikest way to learn more about this is to check out the presentation given at an Oracle User Group event in 2014:


So, what about Data Lakes?  Pivotal's Point of View Blog give a nice description:

Which doesn't look that different to the original ETL that this post started with!

As data volumes grow and speed of data generation continues to increase there will be challenges to overcome and the above architectures are moving in the right direction.  The above approaches encapsulate the solution space from a database and software perspective, so it's worth finally looking at what the hardware world is looking at.  IBM, amongst others no doubt, has realised that the real problem is that the ultimate constraint is what lies between the point of collection and the point of calculation.  To quote a recent speaker at a BCS Lecture "the speed of light just isn't fast enough any more".  The hardware solution seems to be to move the data as close to the calculate layer as possible.  We'll look at that as part of the next episode of this blog!

Sunday 22 March 2015

The First 'C' of Mega Data: Capture

Or perhaps it should be 'C' for Create?.  There are many estimates of just how many devices will be generating data as part of the massive growth of IoE3 (Internet of Everything, Everywhere, Everyone).  I thought it would be interesting to take a look at just how these devices will be identified across the Internet.

Cisco predicts that there will be 50 billion devices by 2020: Most remarkable observation in the infographic (left) that Cisco produced was that already by 2008 there were more devices connected to the Internet than there were people on Earth.

Another observation is rhat the introduction of IPv6 will provide 100 Internet addresses for every atom on the face of the Earth.  That's an estimate that will reassure everyone who's worried that we'll run out of IP addresses!

IPv6 was introduced in 2011 and has since become to be adopted by technology vendors for IP addresses.  Quoting the Internet Society:

"An IP address is basically a postal address for each and every Internet-connected device. Without one, websites would not know where to send the information each time you perform a search or try to access a website. However, the world officially ran out of the 4.3 billion available IPv4 addresses in February 2011.
Yet, hundreds of millions of people are still to come online, many of whom will do so in the next few years. IPv6 is what will allow them to do so, providing enough addresses (2128 to be exact) for everyone and all of their various devices."

So, there you go....we now have an almost unlimited number of addresses that can be used for identifying devices.  Now, just imagine how much data they'll generate.....could be the subject of a future blog.

Sunday 15 March 2015

The Four C's of Mega Data

The term Big Data has a hazy genealogy but is generally considered to have come into use in the 1990's.  Broadly speaking, the main attributes to determine Big Data have been Volume, Velocity and Variability.  As vendors have joined the party, the original 3 V's have been extended to include Veracity, Volume and Various other V's!


With the expected explosion of data arising from IoE3 (Internet of Everything, Everywhere, Everyone) we are now going beyond Big Data and are heading into the era of Mega Data.

 Each of the topics within the subject areas are worthy of an article in their own right.

In future blogs I hope to focus on each of the key areas:

Communicate - Analytics is forecast to become a $9.83 Billion market by 2020.  The power of Data Visualisation continues to grow with many mainstream BI vendors providing toolsets with comprehensive visualisation capabilities.

Calculate -  Moving from traditional statistical models, more and more is being applied to the use of Advanced Machine Learning. Several technology vendors have stepped into this market and there are also courses being promoted by universities.

Curate - This is what replaces the Extract - Transfer - Load phase of traditional Data Warehousing.  There will still be a need for some ETL but with concepts such as Data Federation and Schema on Read then the amount of data transferred from source to target may need to radically change.

Capture - The starting point of the data journey.  Estimates vary about how many devices there will be but forecasts of in excess of 50 Billion devices , proposed by Cisco, don't seem unrealistic.


With this exponential growth of devices to capture data, it will be interesting to see how our networks keep pace. 

Saturday 21 February 2015

Meetup Mashup....the beginning

A quick introduction to the group and how (& why) it exists.......

In the beginning.....there was data.  We had Data Entry Departments and Data Processing functions.  This was very much the domain of big businesses using big computers to process small amounts of data.  This went through various evolutions, with data being captured, processed and analysed, via
mini-computers, then personal computers, then laptops, tablets and (by the 21st Century) mobiles.

Now we're in an era where data is generated by a multitude of devices (forecast to be 50Bn+ by 2020) and the data generation has moved away from the data storage which, in itself, is segregated from the data analysis and analytics.

With the continued proliferation of data generating devices, some just "talking" to themselves, some communicating machine to machine, others acting as Internet endpoints, etc. etc. and the arrival of wearables, connected self, Internet of Things, we're truly in the era of "Big Data" (a term I've never liked but, like Jazz, Marmite and reality TV, it has gained acceptance by others).

There is an approaching Tsunami of data on its way, with billions of devices generating Exabytes of data and I have created this group to explore how we can bring the nexus of forces together:

  • Internet of Things - generating massive volumes, with increasing velocity and variablility
  • Big Data - providing the means to store the data
  • Cloud Computing - putting the scaling of compute power within reach wherever it's needed
  • Machine Learning - developing new paradigms to analyse the data
  • Deep Analytics - bringing the data together and providing the presentation/visualization layer
  • Open Data - Local and Central Government and Public Bodies are releasing datasets into the public domain, providing a wealth of validated, comprehensive, data

The intention is to hold events and discussions, both virtually and physically, to explore the future architecture and paradigms needed to support our information needs in 21st Century.

Why is it called Meetup Mashups?  Well, there's many www.meetup.com groups covering the areas described above.  This group will bring these various perspectives together.....hence, Meetup Mashup.

Welcome.....climb aboard, strap in and join us on a whirlwind journey of discovery!